Last-Click Attribution Analysis
How I exposed a $412K misattribution error in default reporting — and built a multi-touch model to show what the data actually says about paid social spend.
The Workflow
- Last-click model reported TikTok, Facebook & YouTube drove $0 in Q2 revenue.
- Budget decisions were made on platform-level reports, not verified backend journey data.
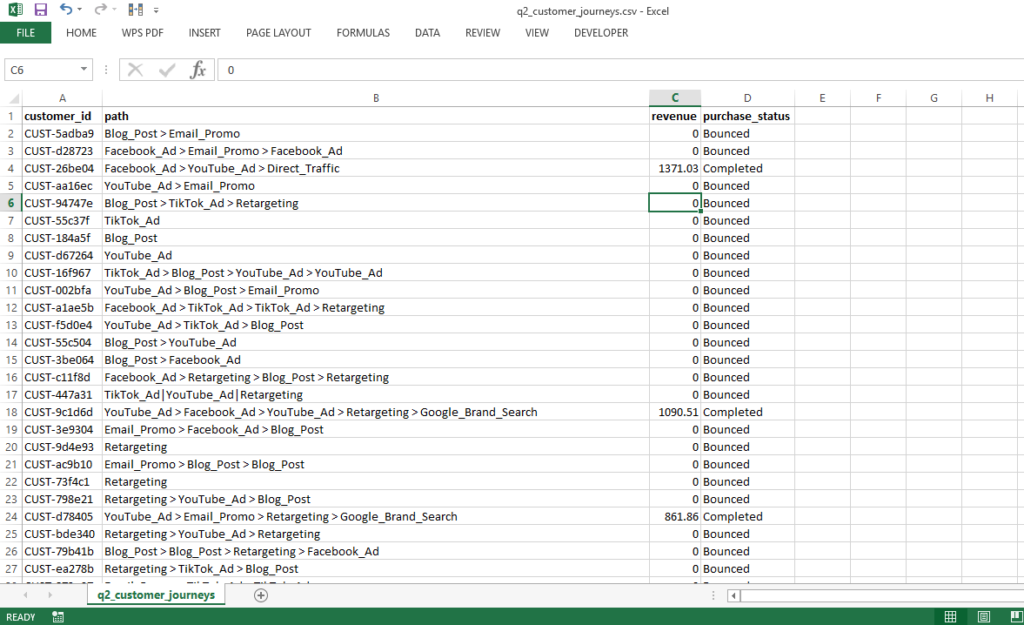
- Raw path data had mixed separators (>, -> and |), making analysis impossible without normalization.
- No visibility into which channels were opening vs. closing the funnel.
- Linear attribution model correctly credited $286K to paid social channels across 5,000 journeys.
- SQL pipeline with nested string normalization resolved the mixed-separator data quality issue.
- Three attribution models (last-click, first-click, linear) run in parallel for a complete picture.
- Clear channel roles identified: TikTok opens, Direct closes — both are necessary, both deserve budget.
The Business Problem: Attribution Crisis Inside the Dashboard
A growth-stage DTC brand was running active paid social campaigns across TikTok, Facebook, and YouTube. Their Q2 performance report — pulled from their default analytics setup — showed all three channels delivering $0 in attributed revenue.
The obvious next move: cut the budget. Why fund channels that aren’t producing?
The problem is that the report wasn’t lying about the data — it was lying about what the data meant. Last-click attribution, the default model in most analytics platforms, assigns 100% of conversion credit to the final touchpoint before a purchase.
If a customer clicked a TikTok ad, then a retargeting ad, then typed the URL directly — Direct Traffic gets the full credit. TikTok gets nothing.
In a world where customers touch 3–4 channels before converting, this isn’t a minor rounding error. It’s a misreading of the structure of how revenue is actually generated.
My Approach: Engineering the Attribution Workflow
To correctly credit revenue across the full customer journey, I bypassed platform-level reports entirely. I built a custom SQL attribution engine directly within the data warehouse, creating a single source of truth that ad platform reporting incentives couldn’t manipulate.
Here is the step-by-step build process:
Before any analysis could begin, I needed a structured schema to hold the raw CSV data. This ensures strict data types and prevents formatting errors during the transformation process.
View SQL Query: Create Raw Journeys Table
CREATE TABLE q2_customer_journeys (
    customer_id VARCHAR(50) NOT NULL,
    path VARCHAR(255) NOT NULL,
    revenue NUMERIC(10, 2) DEFAULT 0.00,
    purchase_status VARCHAR(50),
    PRIMARY KEY (customer_id, path)
);
Architecture Note: Why SQL over Python?
While this logic can easily be written in Pandas—or handled downstream using Power Query in Excel and Power BI—building the attribution model purely in SQL via Recursive CTEs pushes the heavy computation upstream to the data warehouse (e.g., Snowflake, BigQuery). This creates a scalable, automated pipeline that feeds clean, pre-calculated multi-touch data directly into your BI tools without bottlenecking their performance.
Building the Foundation: Normalizing Messy Journey Data
Before any attribution model could run, the raw CSV required normalization. The dataset used three different path separators across records — a common real-world data quality issue that would silently corrupt touchpoint counts if not resolved first.
1. Path Separator Normalization
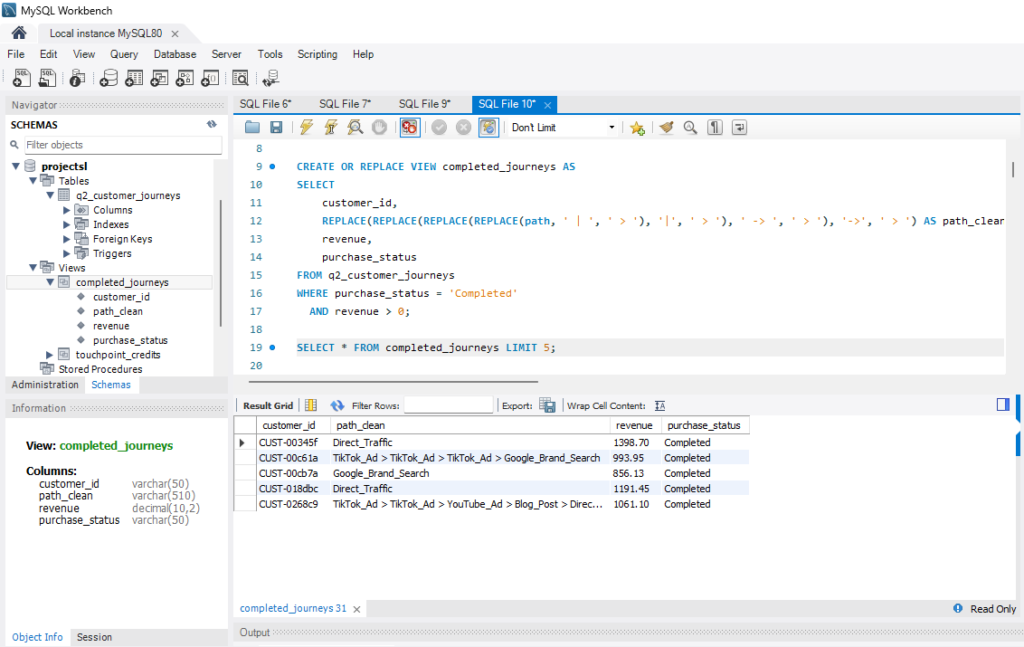
Problem: The path column mixed ” > “, ” -> ” and ” | ” as separators across rows, treating the same channel combinations as different paths.
View SQL Query:
CREATE OR REPLACE VIEW completed_journeys AS
SELECT
    customer_id,
    -- Normalizes all separator variations (' | ', '|', ' -> ', '->') into a clean ' > '
    REPLACE(REPLACE(REPLACE(REPLACE(path, ' | ', ' > '), '|', ' > '), ' -> ', ' > '), '->', ' > ') AS path_clean,
    revenue,
    purchase_status
FROM q2_customer_journeys
WHERE purchase_status = 'Completed'
  AND revenue > 0;
Key Insight
The raw data had three conflicting separator formats — mixing
>,->and|in the same column. Without this normalization step, touchpoints would have been miscounted and every model downstream would have produced incorrect results. Real-world data is always messier than the brief suggests.
2. Unpacking Paths via Recursive CTE
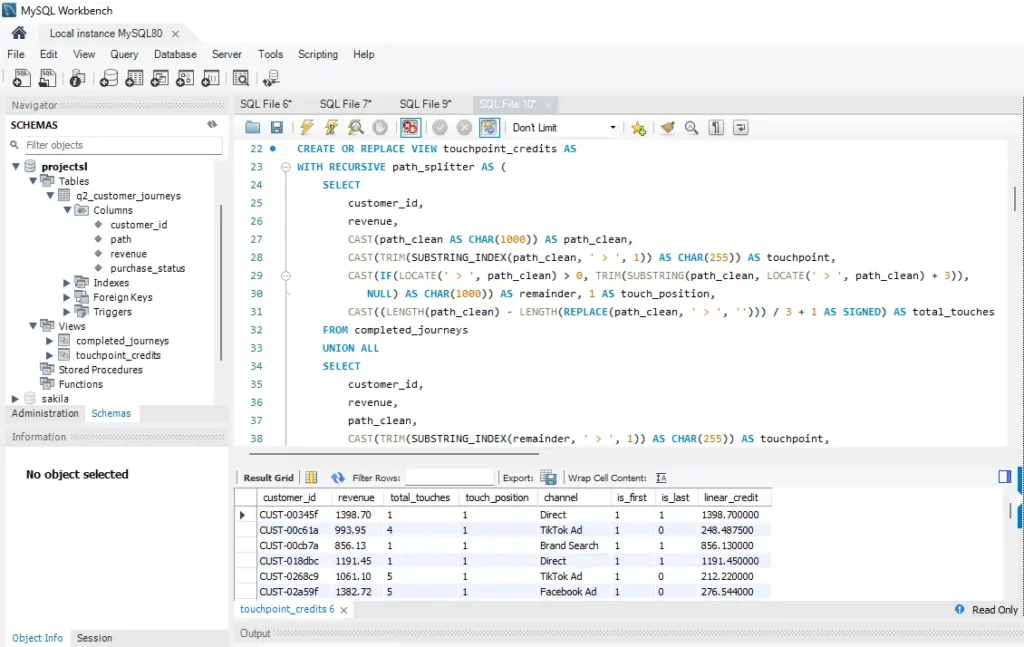
Most CRMs log touchpoints as a single, messy text string. To lay the foundation for the multi-touch attribution model, I use a recursive query to unpack these strings into individual, trackable rows systematically.
View SQL Query:
CREATE OR REPLACE VIEW touchpoint_credits AS
WITH RECURSIVE path_splitter AS (
    SELECT
        customer_id, revenue, CAST(path_clean AS CHAR(1000)) AS path_clean,
        CAST(TRIM(SUBSTRING_INDEX(path_clean, ' > ', 1)) AS CHAR(255)) AS touchpoint,
        CAST(IF(LOCATE(' > ', path_clean) > 0, TRIM(SUBSTRING(path_clean, LOCATE(' > ', path_clean) + 3)), NULL) AS CHAR(1000)) AS remainder,
        1 AS touch_position,
        CAST((LENGTH(path_clean) - LENGTH(REPLACE(path_clean, ' > ', ''))) / 3 + 1 AS SIGNED) AS total_touches
    FROM completed_journeys
    UNION ALL
    SELECT
        customer_id, revenue, path_clean,
        CAST(TRIM(SUBSTRING_INDEX(remainder, ' > ', 1)) AS CHAR(255)) AS touchpoint,
        CAST(IF(LOCATE(' > ', remainder) > 0, TRIM(SUBSTRING(remainder, LOCATE(' > ', remainder) + 3)), NULL) AS CHAR(1000)) AS remainder,
        touch_position + 1, total_touches
    FROM path_splitter
    WHERE remainder IS NOT NULL
),
cleaned AS (
    SELECT
        customer_id, revenue, total_touches, touch_position,
        CASE
            WHEN touchpoint IN ('Direct', 'Direct_Traffic') THEN 'Direct'
            WHEN touchpoint = 'Google_Brand_Search' THEN 'Brand Search'
            ELSE REPLACE(touchpoint, '_', ' ')
        END AS channel,
        CASE WHEN touch_position = 1 THEN 1 ELSE 0 END AS is_first,
        CASE WHEN touch_position = total_touches THEN 1 ELSE 0 END AS is_last,
        revenue / total_touches AS linear_credit
    FROM path_splitter
    WHERE touchpoint IS NOT NULL AND CHAR_LENGTH(TRIM(touchpoint)) > 0
)
SELECT * FROM cleaned;
Proving That Multi-Touch Journeys Drive Conversions
Before building attribution models, I needed to establish a behavioral baseline: do customers who convert actually touch multiple channels, or is the single-touch assumption defensible?
3. Converter vs. Bouncer Path Length Comparison
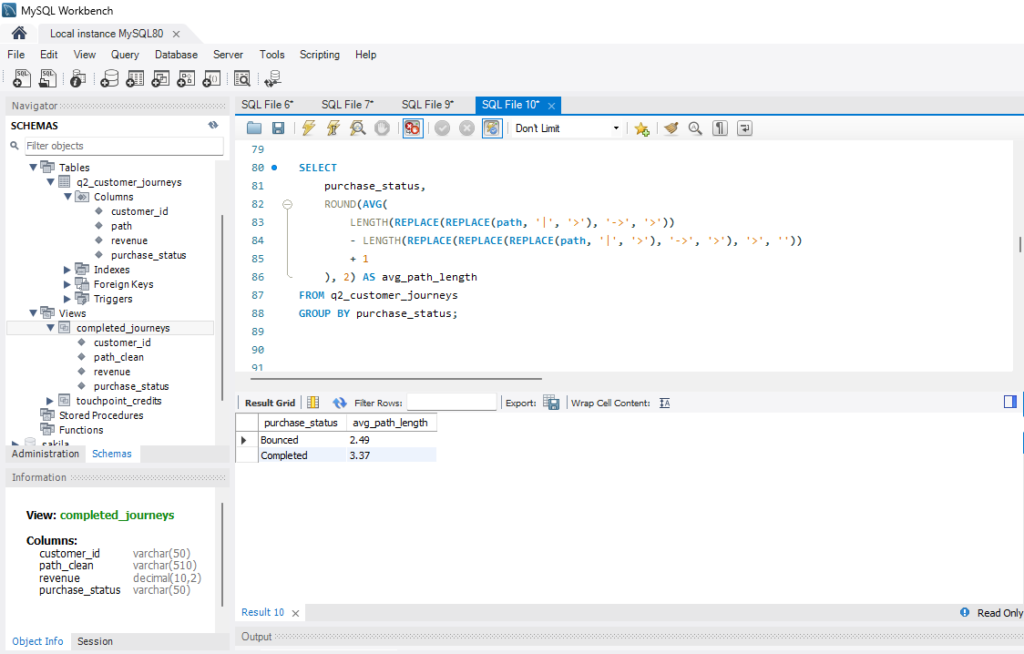
Question: Do converting customers actually interact with more channels than those who bounce?
View SQL Query:
SELECT
    purchase_status,
    ROUND(AVG(
        LENGTH(REPLACE(REPLACE(path, '|', '>'), '->', '>'))
        - LENGTH(REPLACE(REPLACE(REPLACE(path, '|', '>'), '->', '>'), '>', ''))
        + 1
    ), 2) AS avg_path_length
FROM q2_customer_journeys
GROUP BY purchase_status;
Key Insight
Customers who converted averaged 3.37 touchpoints before purchasing. Those who bounced averaged 2.49. The data directly disproves the single-touch assumption that last-click attribution is built on. Longer journeys correlate with higher purchase intent — not channel confusion.
Running Three Attribution Models Against the Same Revenue
With the data cleaned and the multi-touch behavior confirmed, I applied three attribution models to the same 621 converting journeys. Each model answers the same question differently.
- 100% credit to the final touchpoint
- Default in Google Analytics & most CRMs
- Structurally rewards closing channels only
- 100% credit to the initial touchpoint
- Exposes top-of-funnel (TOFU) discovery engines
- Structurally rewards awareness & acquisition
- Revenue split equally across every touchpoint
- Conservative, defensible multi-touch baseline
- Credits the full path, not just the last step
4. Building the Last-Click Model
Question: What does revenue attribution look like when only the final touchpoint is credited?
View SQL Query:
SELECT
    channel,
    ROUND(SUM(revenue), 0) AS last_click_revenue,
    COUNT(DISTINCT customer_id) AS conversions
FROM touchpoint_credits
WHERE is_last = 1
GROUP BY channel
ORDER BY last_click_revenue DESC;
Key Insight
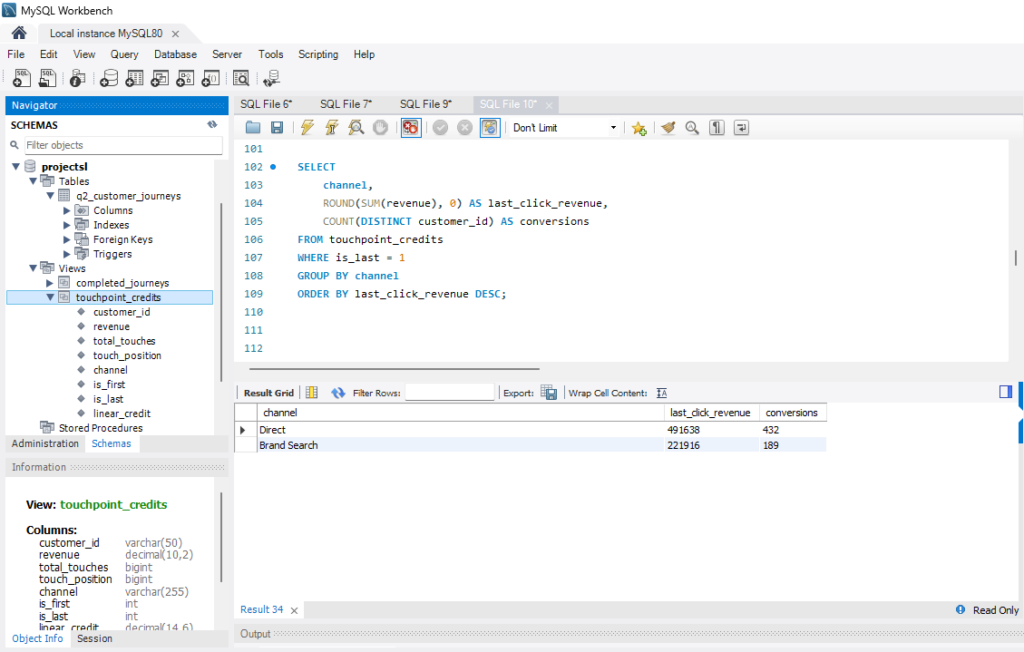
Under last-click attribution, Direct Traffic and Brand Search received 100% of Q2 revenue credit — a combined $713,554. Every paid social channel returned $0. This is the exact report a CMO would receive from a default GA4 setup.
5. Building the First-Click Model
Next, I flipped the attribution logic entirely. To find out where these converting journeys actually began, I built a First-Click model to see which channels were driving initial discovery.
View SQL Query:
SELECT
    channel,
    ROUND(SUM(revenue), 0) AS first_click_revenue,
    COUNT(DISTINCT customer_id) AS conversions
FROM touchpoint_credits
WHERE is_first = 1
GROUP BY channel
ORDER BY first_click_revenue DESC;
Key Insight
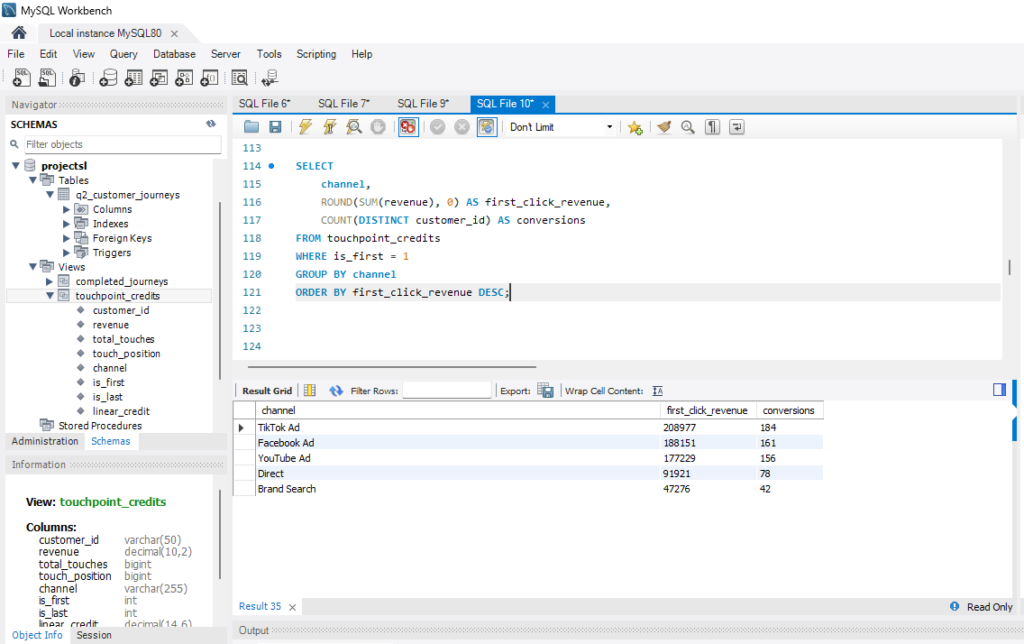
By shifting 100% of the credit to the first touchpoint, the true origin of the pipeline is exposed. TikTok, Facebook, and YouTube initiated over 80% ($574,357) of all Q2 converted revenue. This proves Paid Social is doing exactly what it was designed to do: feed the top of the funnel (TOFU). The default last-click model creates a dangerous blind spot by completely ignoring these critical discovery engines.
6. Building the Linear (Multi-Touch) Model
Question: What does revenue attribution look like when every channel in a converting path receives equal credit?
View SQL Query:
SELECT
    channel,
    ROUND(SUM(linear_credit), 0) AS linear_revenue
FROM touchpoint_credits
GROUP BY channel
ORDER BY linear_revenue DESC;
Key Insight
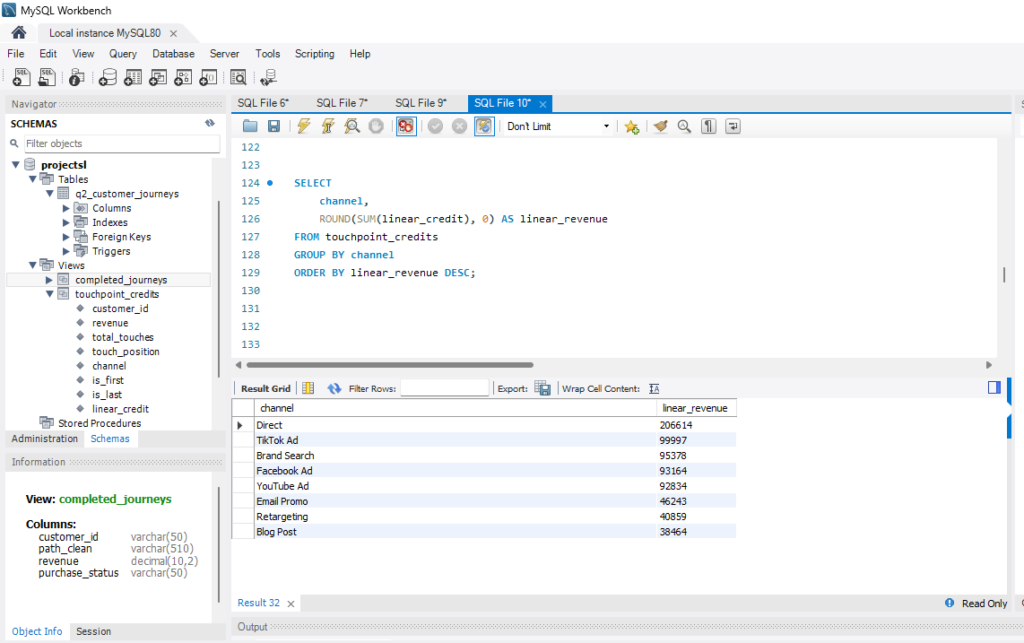
When credit is distributed across the full journey, TikTok, Facebook, and YouTube collectively account for $285,995 — representing 40.1% of total Q2 revenue. Under standard last-click reporting, that number was exactly $0. Meanwhile, Direct Traffic drops from $491,638 down to a still-substantial $206,614, properly reflecting its genuine role as a final closing channel rather than a top-of-funnel discovery engine.
Quantifying the Budget Decision Error
7. Channel-Level Misattribution Delta
Question: For each channel, what is the gap between what last-click reported and what multi-touch modeling shows?
This is the core business finding. By combining the last-click and linear outputs, I isolated the exact financial gap and identified which channels were structurally undervalued by default reporting.
View SQL Query:
WITH last_click AS (
    SELECT channel, ROUND(SUM(revenue), 0) AS lc_revenue
    FROM touchpoint_credits WHERE is_last = 1 GROUP BY channel
),
linear_model AS (
    SELECT channel, ROUND(SUM(linear_credit), 0) AS ln_revenue
    FROM touchpoint_credits GROUP BY channel
),
all_channels AS (
    SELECT channel FROM last_click
    UNION
    SELECT channel FROM linear_model
)
SELECT
    a.channel, COALESCE(lc.lc_revenue, 0) AS last_click_revenue,
    COALESCE(ln.ln_revenue, 0) AS linear_revenue,
    COALESCE(ln.ln_revenue, 0) - COALESCE(lc.lc_revenue, 0) AS delta,
    CASE
        WHEN COALESCE(ln.ln_revenue, 0) - COALESCE(lc.lc_revenue, 0) > 0  THEN 'Undervalued'
        WHEN COALESCE(ln.ln_revenue, 0) - COALESCE(lc.lc_revenue, 0) < 0  THEN 'Over-credited'
        ELSE 'Neutral'
    END AS attribution_status
FROM all_channels a
LEFT JOIN last_click lc ON a.channel = lc.channel
LEFT JOIN linear_model ln ON a.channel = ln.channel
ORDER BY delta DESC;
| Channel | Last Click | Linear | Delta | Status |
|---|---|---|---|---|
| TikTok Ad | $0 | $99,997 | +$99,997 | Undervalued |
| Facebook Ad | $0 | $93,164 | +$93,164 | Undervalued |
| YouTube Ad | $0 | $92,834 | +$92,834 | Undervalued |
| Email Promo | $0 | $46,243 | +$46,243 | Undervalued |
| Retargeting | $0 | $40,859 | +$40,859 | Undervalued |
| Blog Post | $0 | $38,464 | +$38,464 | Undervalued |
| Direct | $491,638 | $206,614 | −$285,024 | Over-credited |
| Brand Search | $221,916 | $95,378 | −$126,538 | Over-credited |
Key Insight
Six channels received $0 credit from last-click attribution despite participating in 37.6% of Q2 converting journeys. Direct and Brand Search are genuine closing channels — but they are receiving credit for work done by paid social upstream. The misattribution delta is not noise; it is structurally baked into how the default model works.
8. Top Converting Path Sequences
Question: What are the actual multi-step paths that generate the most revenue — and do they confirm the channel role hypothesis?
Analyzing the most frequent multi-step sequences proved that paid social channels were initiating the journeys, but direct traffic was getting all the credit for closing them.
View SQL Query:
SELECT
    REPLACE(REPLACE(REPLACE(path_clean, 'Direct_Traffic', 'Direct'), 'Google_Brand_Search',
    'Brand Search'), '_', ' ') AS customer_path,
    COUNT(*) AS conversions,
    ROUND(SUM(revenue), 0) AS total_revenue
FROM completed_journeys
GROUP BY customer_path
HAVING COUNT(*) >= 2
ORDER BY total_revenue DESC
LIMIT 10;
| Full Customer Path | Conversions | Revenue |
|---|---|---|
| Direct | 78 | $91,921 |
| Brand Search | 42 | $47,276 |
| YouTube Ad → Direct | 19 | $22,689 |
| Facebook Ad → Direct | 17 | $21,358 |
| TikTok Ad → Direct | 16 | $16,839 |
| TikTok Ad → Facebook Ad → Direct | 7 | $8,510 |
| YouTube Ad → Brand Search | 7 | $8,125 |
| YouTube Ad → Facebook Ad → Direct | 7 | $7,740 |
| TikTok Ad → Brand Search | 6 | $7,598 |
| Facebook Ad → Retargeting → Direct | 6 | $6,330 |
Key Insight
Every single one of the top 10 converting paths ends in Direct or Brand Search — exactly what the last-click model reports. But 8 of those same 10 paths were initiated by a paid social channel. Last-click reporting sees only the final step of a multi-step relay. Cutting TikTok based on last-click data doesn’t eliminate a non-performing channel—it removes the runner who hands off the baton to your closer.
Strategic Takeaway
Last-click attribution is not wrong about which channel closes the sale. It is wrong about which channels make the sale possible. Paid social (TikTok, Facebook, YouTube) initiated the majority of high-value converting journeys in Q2. Direct and Brand Search closed them. Both roles are essential — but the default model only funds the closer. If paid social budget is cut based on this report, the pipeline feeding Direct and Brand Search shrinks, and revenue falls 30–60 days later with no obvious cause.
Business Impact
By replacing platform-level reports with a robust SQL-based attribution layer built directly from journey log data, the business gained the ability to make budget decisions based on verified, model-agnostic evidence.
Executive Overview: Q2 Attribution Summary
View SQL Query: Revenue Grouped by Path Length
SELECT
    CASE
        WHEN total_touches = 1 THEN '1 touch'
        WHEN total_touches = 2 THEN '2 touches'
        WHEN total_touches = 3 THEN '3 touches'
        ELSE '4+ touches'
    END AS path_length_bucket,
    COUNT(DISTINCT customer_id) AS conversions,
    ROUND(SUM(revenue), 0) AS total_revenue,
    ROUND(AVG(revenue), 0) AS avg_order_value
FROM (
    SELECT DISTINCT customer_id, revenue, total_touches
    FROM touchpoint_credits
) deduped
GROUP BY path_length_bucket
ORDER BY MIN(total_touches);
Strategic Recommendations
Immediate Action: Protect the Discovery Engines
Do not reduce paid social budgets based on standard last-click data. TikTok, Facebook, and YouTube are top-of-funnel initiators, not underperformers. Cutting their spend removes the customers who eventually arrive at Direct and Brand Search—the channels that actually close. Because B2B sales cycles are long, these budget cuts will show up as an unexplained revenue decline 30–60 days later, making the attribution error very difficult to trace.
Short-Term (This Quarter): Shift the Reporting Baseline
Switch from last-click to a linear or position-based model in your primary reporting layer. Most standard analytics platforms support this without requiring additional data engineering. Run both models in parallel for 60 days to build historical confidence before presenting the new baseline to leadership.
Medium-Term (Next 6 Months): Transition to Algorithmic Attribution
Commission a Markov chain attribution model. Unlike heuristic, rule-based models (last-click, linear, first-click), Markov chains calculate the actual incremental contribution of each channel by modeling how the overall conversion probability changes when a specific channel is removed from the path. This is the current industry standard for rigorous, defensible attribution.
On Model Limitations
No attribution model is perfect. The goal of this analysis is not to declare a single “true” model—it is to demonstrate that last-click is not a neutral default. It carries a severe bottom-of-funnel bias. Even a conservative linear model produces channel valuations that are dramatically more accurate and less dangerous to growth than assigning 100% of the credit to the channel a customer happened to touch last.
Need help with attribution, tracking, or reporting work?
If you need support with multi-touch attribution modelling, GA4/GTM setup, SQL-based data analysis, or executive dashboard builds, use the contact page or return to the portfolio to view more project examples.